Trendline Scanner Guide: Find Fresh Support and Resistance Setups
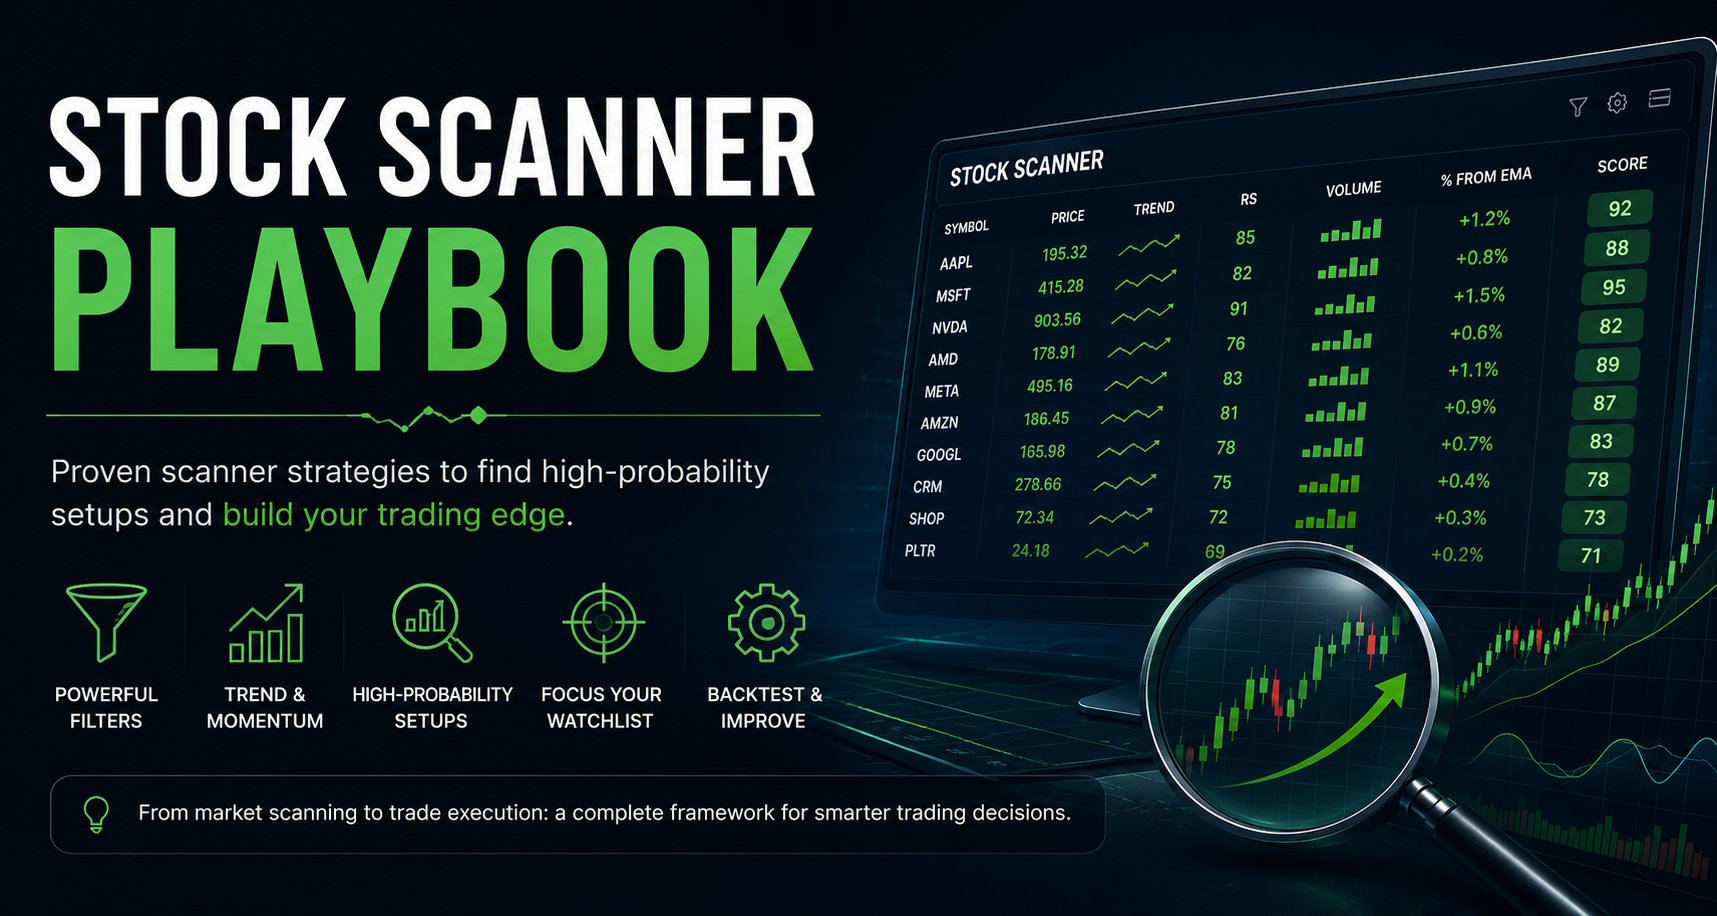
A trendline scanner helps traders find one of the oldest and most practical concepts in technical analysis: price reacting to a rising support line or stalling near a falling resistance line. The problem is that drawing and checking trendlines manually across hundreds or thousands of stocks takes too much time.
That is exactly why LookForTrendline matters inside a modern technical stock scanner. Instead of eyeballing every chart, you can automatically surface stocks where a recent, still-valid trendline is close to the current price and therefore still actionable.
For beginners, think of a trendline as a sloping support or resistance area. For advanced users, think of it as a structured way to detect repeatable chart geometry with recency, precision, and quality scoring.
What Is a Trendline in Simple Terms?
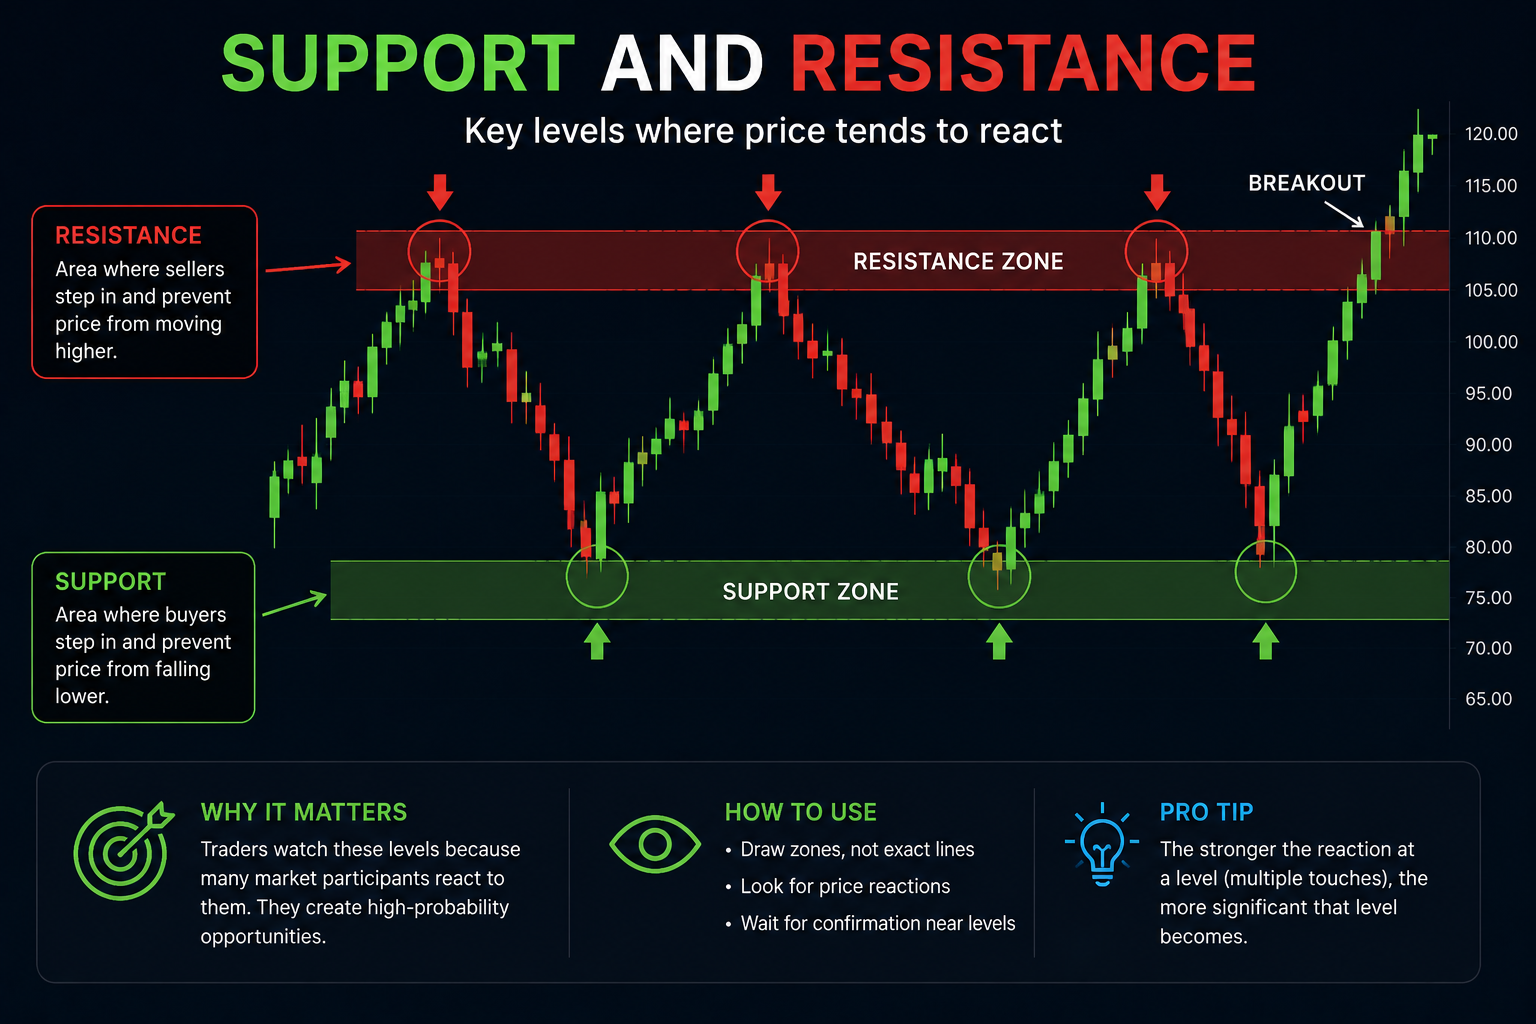
A trendline is a line connecting important highs or lows on a chart. In an uptrend, traders often draw a support trendline under rising lows. In a downtrend, traders may draw a resistance trendline over declining highs.
The core idea is simple: if price keeps respecting the same sloped area, that line can become a useful reference for entries, exits, stop placement, and breakout analysis.
Why a Trendline Scanner Is Useful
Trendlines are helpful, but they are also subjective when drawn manually. Two traders can look at the same chart and draw slightly different lines. A scanner cannot remove all subjectivity, but it can make the process far more consistent.
- It looks for recent pivot points instead of random candle touches.
- It measures how many times price respected the line.
- It checks whether the line has already been broken.
- It prefers lines that are still close enough to current price to matter now.
- It gives a score so you can sort cleaner setups above noisy ones.
What LookForTrendline Actually Scans
The LookForTrendline(source, timeframe, lookback, minTouches, maxAge, tolerancePercent) function is designed to find
recent, still-tradable trendlines, not lines that were relevant months ago and have already failed.
In practice, the scanner is looking for:
- A valid line built from recent highs, lows, or closes.
- Enough touches to avoid random one-off alignments.
- A recent last touch, so the structure is not stale.
- No clear break of the line after the structure formed.
- Current price still near the projected line.
This last point is extremely important. A trendline is far more interesting when price is testing it now than when price is already 12% away from it.
Beginner Use Case: Finding Pullbacks to Trend Support
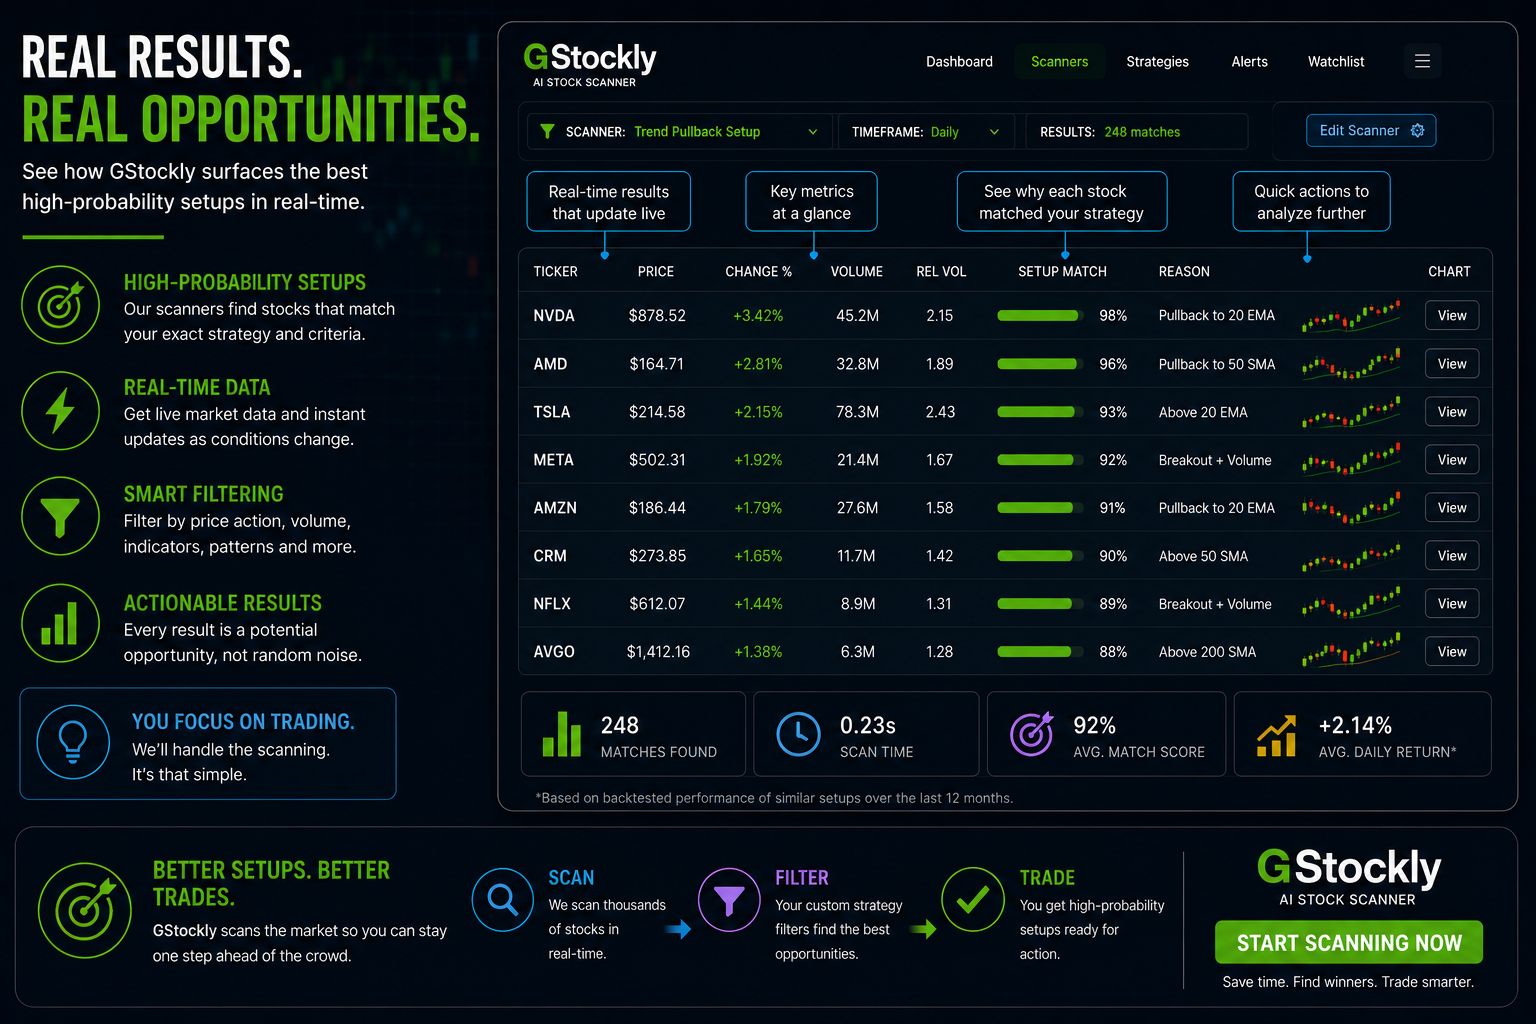
If you are newer to chart reading, the easiest use case is scanning for stocks in an existing uptrend that are pulling back toward a support line. That setup can help you build a focused watchlist of charts worth reviewing.
You do not have to trade blindly from the scan. The scan simply reduces your search space from thousands of stocks to a smaller set of charts where trend structure is already present.
More Technical Use Case: Resistance and Breakout Preparation
More advanced traders can use the same logic from the other side. Instead of looking for support, they can scan for resistance lines above current price and then watch those charts for a clean breakout attempt.
This is where a trendline scanner becomes especially interesting for swing trading: it helps you find setups before the chart becomes obvious to everyone.
How to Read the Parameters
Here is a practical way to think about the main parameters:
- source: use
"Low"for support,"High"for resistance, or"Close"for either side. - timeframe: daily is the default starting point, weekly is great for cleaner medium-term structures.
- lookback: larger values catch broader structures, smaller values catch tighter recent ones.
- minTouches: higher values demand more confirmation but reduce the number of matches.
- maxAge: controls how fresh the last interaction with the line must be.
- tolerancePercent: wider tolerance accepts less precise lines and is often needed on more volatile stocks.
Trendline Scanner Example Script
// @StrategyName: Recent Trendline Support
// @StrategyDescription: Finds liquid stocks pulling back toward a recent support trendline.

IsNotPriceLocked(20, "d") == 1
QuoteAge("d") < 5
AvgCounterValue(20, "d") > 500000
IsUpTrend(30, "d")
LookForTrendline("Low", "d", 120, 3, 12, 1.5) > 72
RSI(14, "d") < 60
ATRPerc(14, "d") > 1.2

AddSignal("Trendline Support Setup")
Resistance Example for Breakout Watchlists
// @StrategyName: Resistance Trendline Watchlist
// @StrategyDescription: Finds stocks approaching a recent descending resistance line.

IsNotPriceLocked(20, "d") == 1
AvgCounterValue(20, "d") > 500000
ChangePerc(63, "d") > 10
LookForTrendline("High", "d", 100, 3, 10, 1.8) > 68
VolumeChangeVsAvg(20, "d") > -10

AddSignal("Trendline Resistance Watch")
How to Use the Trendline Scanner in Real Workflow
- Run the scan on daily or weekly bars.
- Sort by
TrendlineQualityif available in your results view. - Open the top charts and check whether the line still makes visual sense.
- Look for confirmation from candle structure, momentum, or volume.
- Define your risk before entering, usually below support or above resistance.
Who This Is For
This type of stock trendline scanner is useful for:
- Swing traders looking for support retests
- Breakout traders building watchlists before the move
- Beginner traders learning to connect structure with risk management
- Systematic traders who want objective structure-based filters
Final Thoughts
A good trendline scanner does not replace chart reading. It makes chart reading more efficient by surfacing only the stocks where support or resistance structure is still fresh and relevant.
That is what makes LookForTrendline powerful:
it turns a manual charting concept into a repeatable scanning tool without removing the trader's judgment from the final decision.