EMA 50/200 Golden Cross Scanner: Find Fresh Bullish Trend Changes

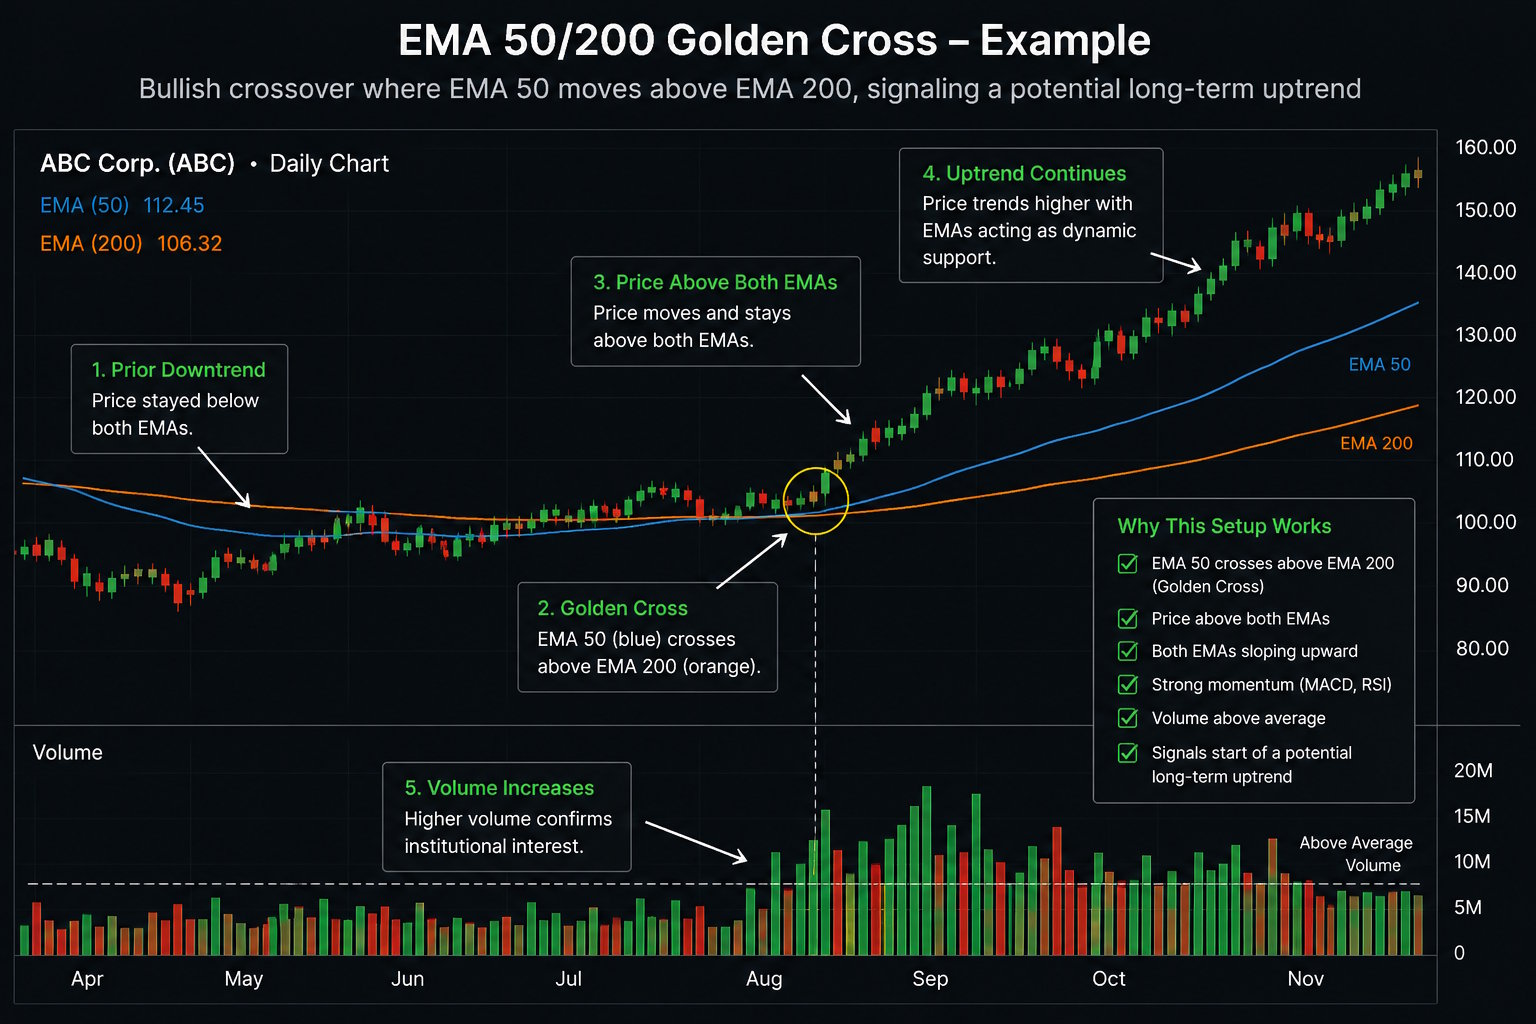
The EMA 50/200 Golden Cross is one of the most widely followed bullish trend signals in technical analysis. It happens when the 50-day exponential moving average crosses above the 200-day exponential moving average, suggesting that the stock may be transitioning from a bearish or neutral phase into a stronger long-term uptrend.
This scanner is designed to find fresh Golden Cross setups, not old signals from months ago. The goal is to identify stocks where the crossover is happening now and where price, momentum, and volume are confirming the potential trend change.
This strategy focuses on long setups on the daily timeframe and is best suited for position traders or swing traders looking for 1 to 6 month trend opportunities.
What Is a Golden Cross?
A Golden Cross occurs when a faster moving average crosses above a slower moving average. In this strategy, the scanner uses the EMA 50 and the EMA 200.
The 50-day EMA represents the medium-term trend, while the 200-day EMA represents the broader long-term trend. When the EMA 50 moves above the EMA 200, it can signal that buyers are gaining control and that the stock is entering a more constructive trend structure.
However, not every Golden Cross is worth trading. Some crossovers happen too late, with price already extended, while others occur when the stock is still weak or moving sideways. That is why this scanner adds several confirmation filters.
What This Scanner Looks For
The EMA 50/200 Golden Cross scanner searches for stocks that meet these conditions:
- Enough trading activity to avoid extremely illiquid stocks
- A fresh bullish crossover where EMA 50 moves above EMA 200
- Price already trading above both EMAs
- Both moving averages rising, especially the EMA 50
- Positive MACD momentum
- RSI in a constructive momentum zone, but not extremely overbought
- Volume above average at the time of the cross
- Price not too extended above the EMA 50
- The stock not deeply broken relative to its all-time high
The result is a more selective Golden Cross scan that looks for healthier trend transitions, not just any moving average crossover.
Why Confirmation Matters
A moving average crossover is a lagging signal by nature. It confirms that price has already improved, but it does not guarantee that the trend will continue.
This is why the strategy checks for additional evidence. Price must be above both EMAs, both EMAs should be rising, MACD must be positive, RSI should show constructive momentum, and volume should be stronger than average.
These filters help avoid weak crossovers where the EMA lines cross but price action remains uncertain. The strongest Golden Cross setups usually happen when the crossover is supported by improving momentum and institutional participation.
Avoiding Late Entries
One common problem with Golden Cross strategies is chasing after the move has already happened. If price is too far above the EMA 50, the setup may already be extended and the risk/reward profile may be poor.
This scanner includes a filter that requires price to be less than 20% above the EMA 50. That does not automatically make the trade low risk, but it helps reduce the chance of scanning stocks that are already extremely stretched.
How to Use the EMA 50/200 Golden Cross Scanner
This strategy is best used as a starting point for a watchlist, not as an automatic buy signal. After running the scan, traders can review the charts manually and look for clean structure.
A practical workflow could look like this:
- Run the EMA 50/200 Golden Cross scanner.
- Open each chart and confirm that the crossover is recent.
- Check that price is above both EMAs and not too extended.
- Review the weekly chart to confirm improving long-term structure.
- Look for a consolidation, pullback, or low-risk entry area after the cross.
- Check earnings dates and major news events before entering.
- Define risk below a key moving average, recent swing low, or support area.
EMA 50/200 Golden Cross Script
// @StrategyName: EMA 50/200 Golden Cross
// @StrategyDescription: Bullish crossover where the EMA 50 moves above the EMA 200, signaling a potential transition into a positive long-term trend structure.

// Universe
AvgCounterValue(20, "d") > 300000

// The Golden Cross: EMA50 crosses above EMA200
CrossEMAEMA(50, 200, "d", "up")

// Price is above both EMAs at the moment of the cross
DistancePercFromEMA(50, "d") > 0
DistancePercFromEMA(200, "d") > 0

// Both EMAs are rising
EMASlope(50, "d") > 0.01
EMASlope(200, "d") > 0

// Momentum confirmation
MACD(12, 26, 9, "d") > 0
RSI(14, "d") > 45
RSI(14, "d") < 72

// Volume confirmation
VolumeChangeVsAvg(20, "d") > 10

// Not over-extended
DistancePercFromEMA(50, "d") < 20
DistancePercFromAllTimeHigh() > -60

// Tag
AddSignal("EMA 50/200 Golden Cross")
Who Is This Scanner For?
This scanner can be useful for position traders, trend followers, and swing traders who want to find stocks entering a potentially stronger long-term trend phase. It is especially useful for traders who prefer confirmation over bottom picking.
The EMA 50/200 Golden Cross is not a perfect signal, and it should not be used alone. It works best when combined with chart structure, market context, sector strength, earnings awareness, and a clear risk management plan.
Final Thoughts
The EMA 50/200 Golden Cross scanner helps traders identify fresh bullish trend transition signals with additional confirmation from price, momentum, and volume. Instead of searching manually through thousands of charts, this strategy narrows the market to stocks where a major long-term moving average crossover is happening now.
Used correctly, it can become a practical first step for building a watchlist of potential long-term trend continuation candidates.