Pullback to EMA Scanner: Find Stocks Near Key Dynamic Support

Some of the best trend-following setups do not happen when a stock is making a new high. They happen when a strong stock pulls back toward a widely watched moving average and gives traders a second chance to enter the trend.
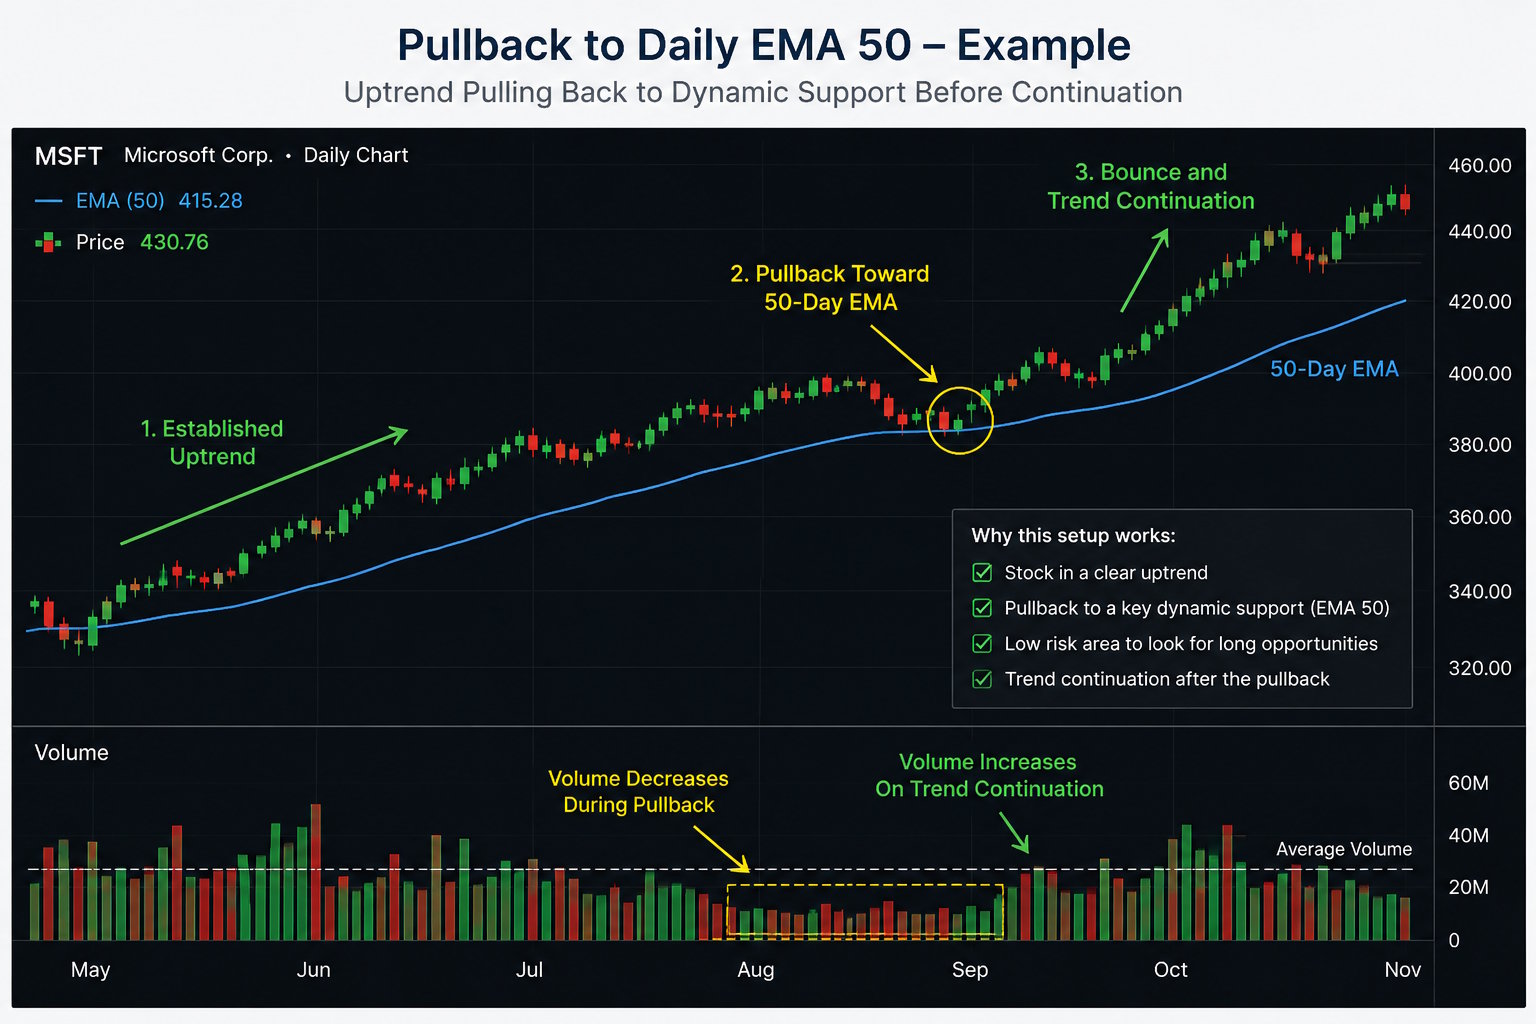
The Pullback to Daily EMA scanner is designed to find stocks in established uptrends that are trading very close to an important exponential moving average, such as the 50-day EMA, 100-day EMA, or 200-day EMA. These areas often act as dynamic support zones for medium-term trend continuation.
In this example the strategy uses the 50-day EMA, but the same concept can be adapted to the 100-day EMA or 200-day EMA depending on your trading timeframe.
Why EMA Pullbacks Matter
In a healthy uptrend, price rarely moves in a straight line. Stocks advance, pause, pull back, and then either continue higher or lose trend structure.
The 50-day EMA is one of the most commonly followed moving averages by swing traders and medium-term trend traders. When a strong stock pulls back toward this area without breaking its broader uptrend, it can become a potential continuation setup.
The goal is not to buy every stock near an EMA. The goal is to find liquid stocks that are still in a clear uptrend and are only temporarily pulling back toward a key support area.
What This Scanner Looks For
The Pullback to Daily EMA scanner filters the market for stocks that meet a few important conditions:
- Fresh quote data, updated recently
- Enough liquidity to avoid thin and unreliable stocks
- A valid long-term uptrend on the weekly timeframe
- No recent downside cross below the selected EMA
- Price trading very close to the EMA, between 0% and 2% above it
This creates a focused list of stocks that are not extended, but are also not deeply broken. They are simply pulling back toward a relevant trend level.
The Logic Behind the Strategy
This scanner is built around a simple idea: strong stocks often respect important moving averages during trend continuation phases.
First, the scanner removes outdated or locked quotes. Then it applies a liquidity filter so the results focus on stocks with meaningful trading activity.
After that, it checks for a weekly uptrend and verifies that the stock has not crossed below the selected EMA during the last 90 trading days. Finally, it looks for stocks trading between 0% and 2% above the EMA.
This combination helps identify stocks that are close to support without already showing a significant trend failure.
How to Use the Pullback to EMA Scanner
This strategy works best as a watchlist builder. After running the scan, each chart should still be reviewed manually.
A practical workflow could look like this:
- Run the Pullback to Daily EMA scanner.
- Open each chart and check if the weekly trend is clean.
- Confirm that price is pulling back calmly, not collapsing with heavy selling.
- Look for a bullish reversal candle, tight consolidation, or renewed volume.
- Define a possible entry above the reversal area.
- Place risk below the EMA area or below the recent swing low.
- Skip the setup if the risk/reward ratio is not attractive.
50 EMA, 100 EMA, or 200 EMA?
The 50-day EMA is usually more useful for medium-term swing trading. It reacts faster and tends to capture shorter pullbacks inside active trends.
The 100-day EMA is slower and may be useful for traders looking for deeper pullbacks. The 200-day EMA is even more important from a long-term perspective and is often watched by investors and position traders.
In gStockly, the strategy can be adjusted by changing the EMA parameter.
For example, setting MyEma=100 or MyEma=200 allows traders to scan for pullbacks to longer-term dynamic support levels.
Pullback to Daily EMA Script
// @StrategyName: Pullback to Daily EMA 50
// @StrategyDescription: Stocks in an established uptrend pulling back toward the daily EMA 50, a widely followed dynamic support area for medium-term trend continuation.

MyEma=50;

// Only today update quote
QuoteAge("d") <= 2
IsNotPriceLocked(10, "d")

// Liquidity filter
AvgCounterValue(20, "d") > 5000000

// Price has not crossed below the selected EMA in the last 90 days
CrossedEMAWithin(MyEma, "d", "Down", 90) == 0

// Established weekly uptrend
IsUpTrend(52, "w")

// Price is close to the selected EMA
DistancePercFromEMA(MyEma, "d") >= 0
DistancePercFromEMA(MyEma, "d") <= 2
Who Is This Scanner For?
This scanner can be useful for swing traders, trend followers, and investors looking for pullback opportunities inside existing uptrends. It is especially helpful for traders who prefer buying strength on controlled weakness instead of chasing breakouts after a large move.
As always, the scan itself is only the first step. Traders should confirm the chart structure, check upcoming earnings, define risk, and wait for a valid entry signal before taking a position.
Final Thoughts
The Pullback to Daily EMA scanner helps identify stocks that are trending higher but temporarily resting near a key moving average. This can be a useful setup for traders looking for trend continuation opportunities with a clear technical reference point.
Instead of scanning randomly through thousands of charts, this strategy helps narrow the market to stocks that are already strong and currently near a potential support zone.