Pre-Breakout Bollinger Squeeze Scanner: Find Stocks Before Volatility Expansion
Most traders notice a breakout only after the stock has already moved. The goal of a Bollinger Squeeze scanner is different: to identify stocks that are still quiet, compressed, and potentially preparing for a directional move.
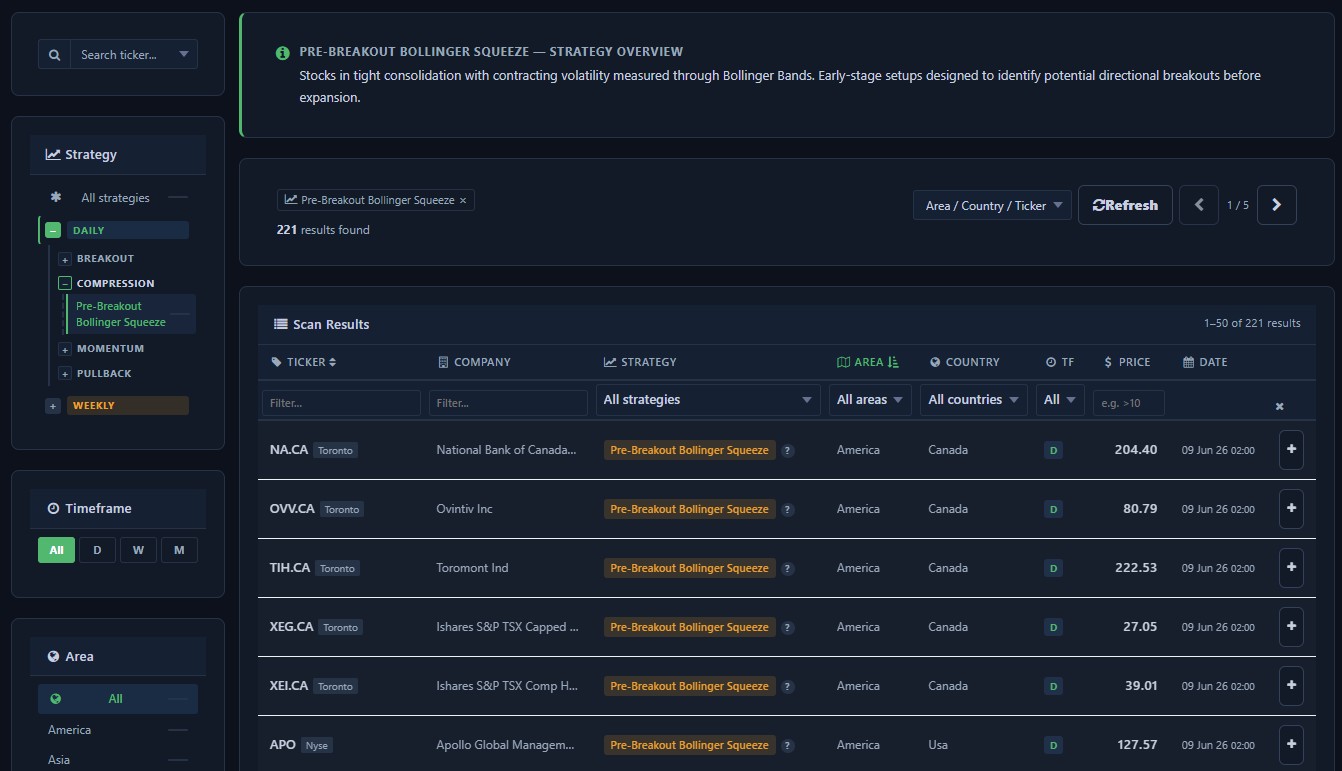
The Pre-Breakout Bollinger Squeeze strategy is designed to find stocks trading inside tight consolidations, where volatility is contracting and price has not yet expanded outside its range. These are early-stage breakout setups, useful for traders who want to build a watchlist before the move becomes obvious.
What Is a Bollinger Squeeze?
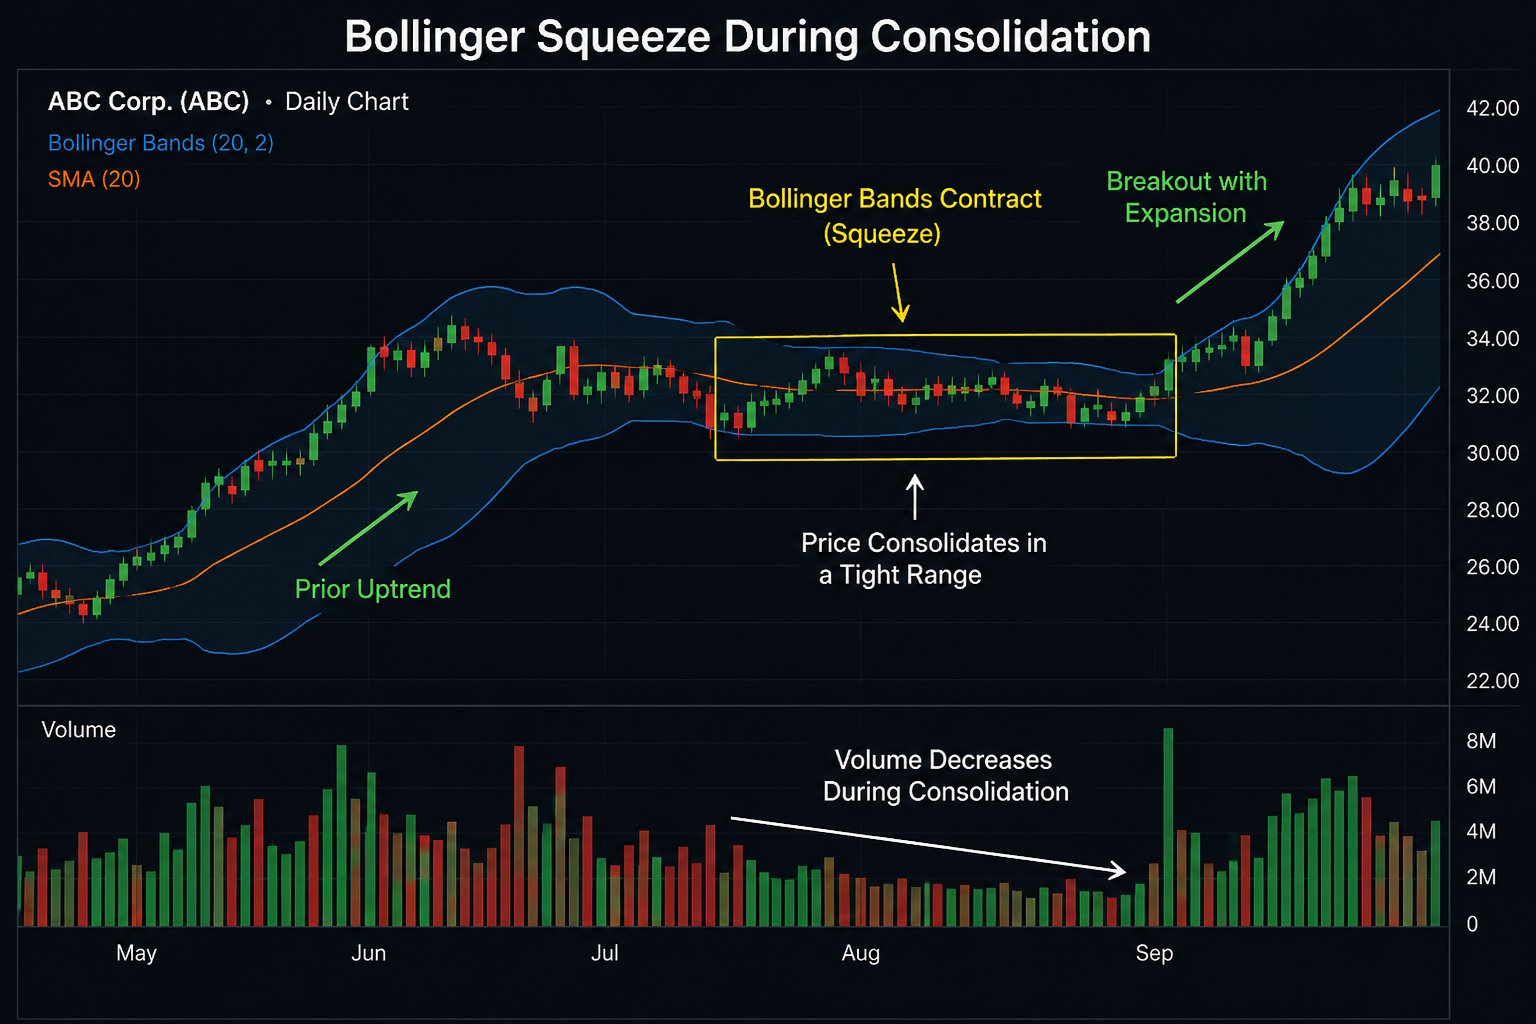
A Bollinger Squeeze happens when Bollinger Bands contract around price. This usually means volatility has decreased and the stock is moving in a narrow range.
Low volatility does not predict direction by itself. However, periods of volatility contraction are often followed by volatility expansion. That expansion can lead to a breakout, a breakdown, or a strong directional move.
This is why many swing traders and breakout traders monitor Bollinger Band compression when building their weekly watchlists.
What This Scanner Looks For
The Pre-Breakout Bollinger Squeeze scanner searches for stocks that combine liquidity, constructive trend structure, low volatility, quiet volume, and neutral-to-positive momentum.
- Recent and valid market data
- Good liquidity to avoid illiquid penny stocks
- A positive medium-term trend before the consolidation
- Contracting Bollinger Band width
- Low historical volatility
- Price still positioned inside the middle area of the bands
- Declining volume during consolidation
- RSI that is neutral or moderately positive
The objective is not to buy every stock returned by the scan. The objective is to reduce thousands of tickers into a focused list of pre-breakout candidates.
Why Trend Matters Before the Squeeze
Not every squeeze is worth watching. A stock can squeeze because it is building strength before another move higher, or simply because nobody is interested in trading it.
This strategy filters for stocks with a constructive background trend. It looks for names that have gained more than 8% over the last 63 trading days, remain reasonably close to their 50-day EMA, and have a rising 50-day EMA slope.
In simple terms, the scanner looks for compression inside a positive trend, not random sideways noise.
Why Volume Contraction Is Important
One of the key filters in this strategy is volume contraction. During a healthy consolidation, volume often declines as price tightens and fewer market participants are willing to sell aggressively.
This quiet behavior can become interesting when price later breaks out with expanding volume. A breakout after compression is often more meaningful than a move that happens after the stock is already extended.
How to Use the Pre-Breakout Bollinger Squeeze Scanner
This scanner is best used as a watchlist builder. After running the scan, traders can manually review each chart and look for a clean technical structure.
- A tight consolidation range
- Clear resistance above price
- Support below the current range
- No immediate earnings risk
- A possible breakout level
- Volume expansion on the breakout candle
The scanner does the first part of the work: finding stocks with the right pre-breakout conditions. The final decision should still depend on chart quality, confirmation, position sizing, and risk management.
Example Trading Workflow
- Run the Pre-Breakout Bollinger Squeeze scanner.
- Open the charts of the stocks returned by the scan.
- Remove stocks with messy price action or unclear resistance.
- Mark the consolidation high as a potential breakout level.
- Wait for a close above resistance or an intraday breakout with strong volume.
- Define a stop loss below the consolidation area.
- Enter only if the risk/reward ratio is acceptable.
Pre-Breakout Bollinger Squeeze Script
////// @StrategyName: Pre-Breakout Bollinger Squeeze
// @StrategyCode: pre_breakout_squeeze
// @StrategyDescription: Stocks in tight consolidation with contracting volatility measured through Bollinger Bands. Early-stage setups designed to identify potential directional breakouts before expansion.

// Base filters
QuoteAge("d") < 3
IsNotPriceLocked(20, "d") == 1

// Liquidity
AvgCounterValue(20, "d") > 5000000

// Background trend
ChangePerc(63, "d") > 8
DistancePercFromEMA(50, "d") > -10
EMASlope(50, "d") > 0

// Bollinger Squeeze
BollingerWidth(20, 2, "d") < 10
AvgVolatility(20, "d") < 2.5

// Position inside the bands
BollingerPosition(20, 2, "d") > 25
BollingerPosition(20, 2, "d") < 75

// Contracting volume
VolumeProfile(20, "d") < 40
VolumeChangeVsAvg(20, "d") < 30

// Neutral / positive momentum
RSI(14, "d") > 40
RSI(14, "d") < 68
Who Is This Scanner For?
This strategy can be useful for swing traders, breakout traders, and technical traders who want to identify stocks before volatility expands. It is especially useful for traders who prefer preparing watchlists in advance instead of chasing breakouts after they already happened.
Final Thoughts
The Pre-Breakout Bollinger Squeeze scanner is not designed to predict the future. It is designed to find a specific market condition: liquid stocks, positive trend structure, tight Bollinger Bands, low volatility, quiet volume, and neutral-to-positive momentum.
Used correctly, it becomes a practical first step in a disciplined breakout trading workflow.