How to Read Trading System Results: A Beginner-Friendly Guide
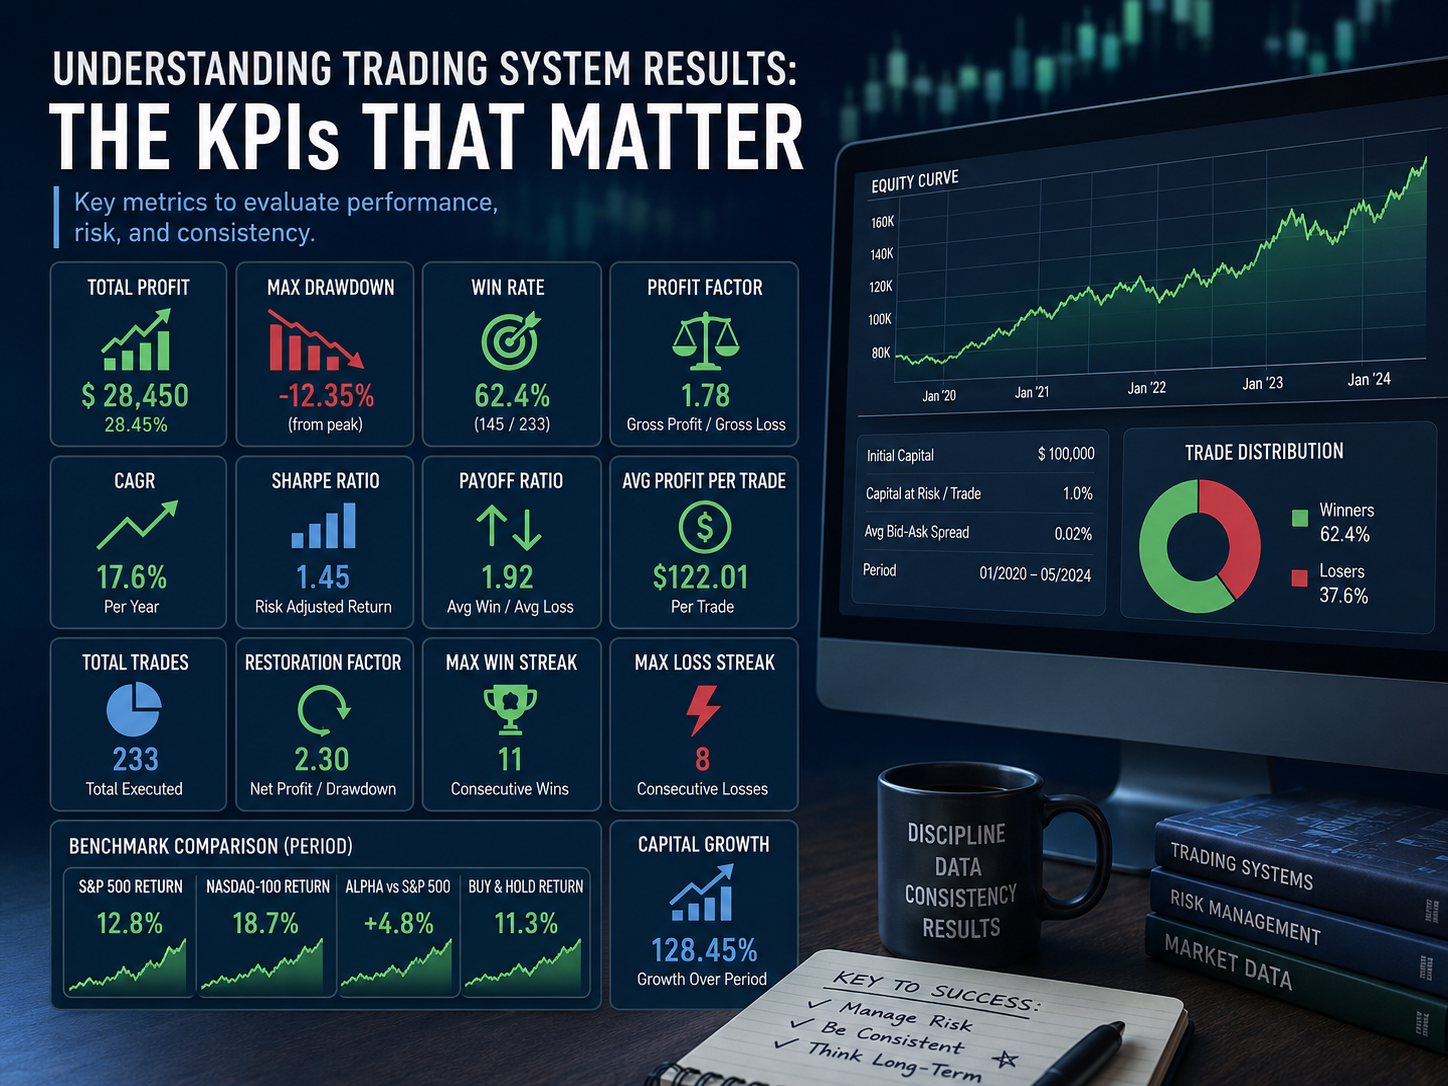
When you run a backtest, the platform gives you a lot of numbers: profit, drawdown, Sharpe ratio, win rate, streaks, benchmark returns, and more. For a beginner, that can feel confusing very quickly.
The good news is that you do not need to understand every metric at once. A trading system report becomes much easier to read when you know which numbers matter first, what each one means, and how they work together.
In this guide, we will explain the most important trading system metrics in simple English, using the same kind of values you usually see inside a backtest report.
A strategy is not good only because it made money.
A strategy is good when it makes money with acceptable risk, over a meaningful number of trades, and in a way you could realistically follow in real life.
What Beginners Should Look At First
If you are new, start with these five metrics before anything else:
- Total Profit - Did the strategy actually make money?
- Max Drawdown - How painful was the worst decline?
- Total Trades - Is there enough data to trust the result?
- Profit Factor - Did the wins clearly outweigh the losses?
- Benchmark Comparison - Was the strategy better than simply buying and holding?
Once those five make sense, then you can move on to Sharpe ratio, win rate, annual return, payoff ratio, streaks, and the other supporting metrics.
1. Total Profit
What it means:
The total amount of money the strategy made or lost during the test period.
Why it matters:
This is the fastest answer to the question: Did this strategy make money?
Beginner warning:
Do not stop here. A strategy can make a lot of money and still be too risky to use.
2. Final Equity
What it means:
The value of your account at the end of the backtest.
If you started with $10,000 and ended with $17,500, your Final Equity is $17,500. This is often easier for beginners to visualize than percentages alone.
3. Capital Growth
What it means:
The percentage gain or loss on the starting capital.
This is simply the percentage version of Total Profit.
4. Max Drawdown
What it means:
The biggest account drop from a peak to a later low point.
Your account grows from $10,000 to $15,000, then falls to $11,000 before recovering.
Your max drawdown is $4,000, or 26.7%.
Why it matters:
Drawdown measures pain. Even a profitable strategy can be hard to follow if the losses become too large.
- Under 10% - Usually conservative
- 10% to 20% - Often acceptable
- 20% to 30% - Aggressive
- Above 30% - Risky for most beginners
5. Annual Return / CAGR
What it means:
CAGR stands for Compound Annual Growth Rate. It tells you the average yearly growth of the strategy over the full test period.
Why it matters:
CAGR lets you compare strategies more fairly over time.
A strategy that made 60% in one year is very different from a strategy that made 60% over six years.
6. Win Rate
What it means:
The percentage of trades that ended in profit.
Why it matters:
It tells you how often the strategy was right.
But do not misunderstand it:
A high win rate does not guarantee a good strategy.
If the losses are larger than the wins, the system can still lose money overall.
7. Total Trades
What it means:
The number of completed trades in the test.
Why it matters:
More trades usually mean more statistical reliability.
A strategy with 5 trades is much harder to trust than a strategy with 100 trades.
Be careful with beautiful results based on very few trades.
Small samples can be misleading.
8. Avg Profit per Trade
What it means:
The average amount made or lost on each trade.
This helps you understand whether the strategy has a real edge on each trade, not just one lucky big winner.
9. Profit Factor
What it means:
The ratio between gross profits and gross losses.
Why it matters:
It tells you how much money the strategy made for every dollar it lost.
This is one of the best metrics for beginners because it balances wins and losses in one number.
- Below 1.0 - Losing system
- 1.0 to 1.3 - Weak or fragile
- 1.3 to 1.7 - Decent
- 1.7 to 2.0 - Strong
- Above 2.0 - Very strong
10. Payoff Ratio
What it means:
The average winning trade divided by the average losing trade.
This tells you whether your winners are bigger than your losers. A strategy can win only 40% of the time and still be profitable if the average winner is much larger than the average loser.
11. Sharpe Ratio
What it means:
A measure of return adjusted for risk and volatility.
Why it matters:
Two strategies can have similar returns, but one may reach them in a much smoother and more stable way.
Sharpe tries to capture that difference.
- Below 1 - Weak
- 1 to 2 - Good
- 2 to 3 - Very good
- Above 3 - Excellent
Beginner note:
Sharpe is important, but do not start from it.
First understand profit, drawdown, trade count, and profit factor.
12. Max Winning Streak and Max Losing Streak
What they mean:
The longest sequence of winning trades or losing trades in a row.
Why they matter:
These numbers are mainly psychological.
If your strategy can produce 8 losses in a row, you need to know that in advance.
Otherwise you may abandon a valid system at exactly the wrong time.
13. Capital at Risk per Trade
What it means:
How much capital the strategy allocates to each trade.
Even a good strategy can become dangerous if the position sizing is too aggressive. Risk management is often more important than the entry signal itself.
14. Benchmark Comparison
What it means:
Comparing your strategy with a simple passive alternative such as the S&P 500, Nasdaq-100, or a plain buy-and-hold approach.
- S&P 500 Return - How the broad market performed
- Nasdaq-100 Return - How large growth stocks performed
- Buy & Hold Return - What would have happened without active trading
- Alpha vs S&P 500 - The difference between strategy return and benchmark return
Why it matters:
If your strategy performs worse than a simple index investment, the extra complexity may not be worth it.
15. Spread, Commissions, and Realism
A backtest is only useful if the assumptions are realistic. Spread, commissions, taxes, and execution type can all change the final result.
A strategy that looks amazing before costs may become average after realistic costs are included.
16. Initial Capital and Position Size
Results depend on account size and how much money is put into each trade. Always check whether the backtest used realistic sizing rules for your real account.
17. Test Period
A strategy tested only during a bull market may look much better than it really is. Good testing should include different market conditions:
- Bull markets
- Bear markets
- Sideways markets
- High-volatility periods
A Simple Beginner Checklist
Before getting excited about a strategy, ask yourself:
- Did it make money?
- Was the drawdown acceptable?
- Were there enough trades to trust the sample?
- Is the profit factor above 1 and comfortably above 1?
- Did it beat buy and hold or at least justify the extra work?
- Could I emotionally survive the losing streaks?
Final Thoughts
The biggest beginner mistake is focusing on only one metric. A high win rate alone means nothing. A high total profit alone means little if the drawdown was extreme. A beautiful CAGR can hide a strategy with too few trades.
A trading system should be judged as a whole:
return, risk, consistency, realism, and survivability.
Start simple. Learn to read profit, drawdown, profit factor, trade count, and benchmark comparison first. Once those make sense, the rest of the report becomes much easier to understand.