Bull Flag Breakout Scanner: How to Catch the Second Leg of Momentum
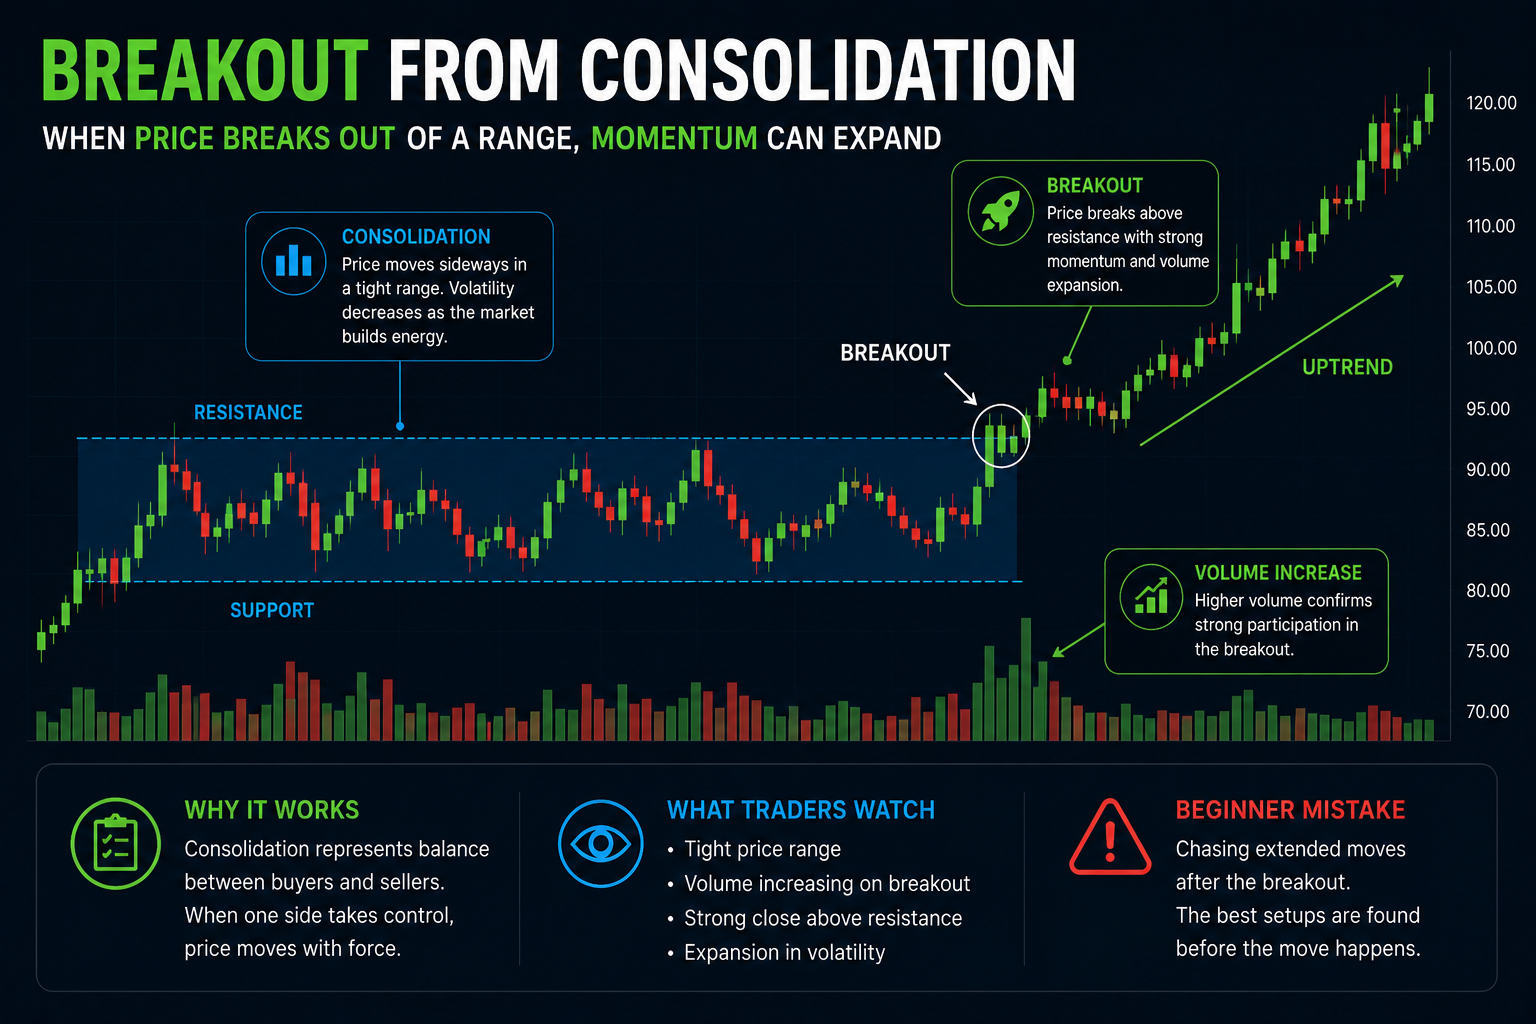
One of the most frustrating trading mistakes is buying a strong stock either too early during a pullback or too late after the breakout is already extended. That is why the bull flag breakout scanner is so useful: it helps traders focus on momentum setups where a strong first move already happened, a controlled pause formed, and a fresh breakout may now be starting.
In simple terms, this is the classic search for the second leg of a move. In scanner terms, it is the difference between finding any bullish trend and finding a specific continuation structure with timing.
If you are new to chart patterns, think of a bull flag as a sharp price jump followed by a smaller, calmer pause. If you are more advanced, think of it as a continuation structure defined by pole strength, retracement depth, channel behavior, and breakout location.
What Is a Bull Flag?
A bull flag usually has two parts:
- A strong directional move higher, often called the pole
- A short pullback or sideways pause, often called the flag
The idea is that buyers took control during the first push, then price paused while weaker hands sold into the move, and finally the stock tried to resume higher again.
That is why many traders like this structure: it often offers a more organized continuation entry than blindly chasing momentum.
Why a Flag Breakout Scanner Is Better Than Manual Search
You can absolutely recognize bull flags manually. The problem is that manually searching for them is slow and inconsistent. Some charts look like flags but are too deep, too loose, too old, or already broken.
A proper flag breakout stock scanner helps by filtering for things that matter:
- A meaningful pole
- A controlled pullback instead of a messy reversal
- Volume behavior that makes sense for a continuation pattern
- Price still near the breakout area
- An actual fresh breakout when you specifically use the breakout version
The Difference Between LookForFlag and LookForFlagBreakout
This distinction matters a lot.
LookForFlag, LookForBullFlag, and LookForBearFlag are pattern scanners.
They help you find continuation structures that are still valid and near price.
LookForFlagBreakout, LookForBullFlagBreakout, and LookForBearFlagBreakout go one step further:
they only keep patterns where the latest bar is already confirming a fresh break of the flag channel.
In practical terms:
- Use LookForBullFlag to build a watchlist before the breakout.
- Use LookForBullFlagBreakout when you want the continuation trigger happening now.
What the Updated Flag Logic Looks For
A high-quality continuation setup should not just “look roughly okay.” It should have specific traits:
- A pole strong enough to matter
- A pullback that is not too deep
- A flag channel that is still orderly
- Lower or quieter volume during the flag compared with the pole
- Price still close to the breakout line
- For breakout scans, a fresh break on the latest bar
This is why the newer logic is more useful for traders trying to catch the second move, not just label a chart pattern after the fact.
Beginner Use Case: Building a Watchlist Before the Breakout
If you are still learning chart patterns, the safest starting point is not to trade every breakout immediately.
Instead, use LookForBullFlag to generate a shortlist of stocks already in strong trends and then review them manually.
That helps you learn what healthy continuation structure looks like without forcing instant execution.
Advanced Use Case: Triggering Only Fresh Continuation Breakouts
More advanced momentum traders often care less about the flag itself and more about the timing of the release.
That is exactly where LookForBullFlagBreakout can help.
It narrows the market to those charts where the pattern and the breakout are happening together.
Bull Flag Watchlist Example
// @StrategyName: Bull Flag Watchlist
// @StrategyDescription: Finds valid bull flags before the actual breakout.

IsNotPriceLocked(20, "d") == 1
QuoteAge("d") < 5
AvgCounterValue(20, "d") > 750000
IsUpTrend(30, "d")
LookForBullFlag(80, "d") > 68
RSI(14, "d") > 45
RSI(14, "d") < 72

AddSignal("Bull Flag Watchlist")
Fresh Breakout Example
// @StrategyName: Bull Flag Breakout
// @StrategyDescription: Finds fresh bull flag breakouts for second-leg momentum entries.

IsNotPriceLocked(20, "d") == 1
AvgCounterValue(20, "d") > 1000000
IsUpTrend(30, "d")
LookForBullFlagBreakout(80, "d", 0.5) > 70
VolumeChangeVsAvg(20, "d") > 10
ATRPerc(14, "d") > 1.2

AddSignal("Bull Flag Breakout")
How to Use the Extra Data
The updated flag logic is more useful because it exposes details you can actually use during review:
FlagPolePctshows how strong the initial move wasFlagRetracementPcthelps you reject overly deep pullbacksFlagDistancePcttells you how close price is to the breakout zoneFlagRiskRewardhelps compare setups more intelligentlyFlagPoleVolumeRatioandFlagVolumeRatiohelp validate the continuation logicFlagBreakoutConfirmedtells you whether the breakout version actually triggered
Who This Scanner Is For
These flag functions are especially useful for:
- Momentum swing traders
- Breakout traders who want better timing
- Trend followers who prefer continuation over reversal setups
- Beginner traders learning how strong moves pause before resuming
Final Thoughts
A bull flag breakout scanner is useful because it helps you focus on the exact phase many traders want: not the random middle of the move, and not the pattern long after it has already expanded, but the moment when a structured pause may be resolving.
That makes LookForBullFlag a good watchlist tool and LookForBullFlagBreakout a stronger trigger tool for second-leg momentum entries.