Why Moving Averages Matter More Than Beginners Think
Most beginner traders underestimate moving averages.
At first glance, they simply look like lines following price.
But in reality, moving averages are among the most widely used tools in technical analysis.
Institutional traders, hedge funds, swing traders, algorithms, and retail investors all monitor them daily.
This creates repeated reactions that traders can learn to recognize.
What Is a Moving Average?
A moving average is simply the average price of a stock over a specific period of time.
Instead of reacting to every small price fluctuation, moving averages help smooth out noise and reveal the underlying trend.
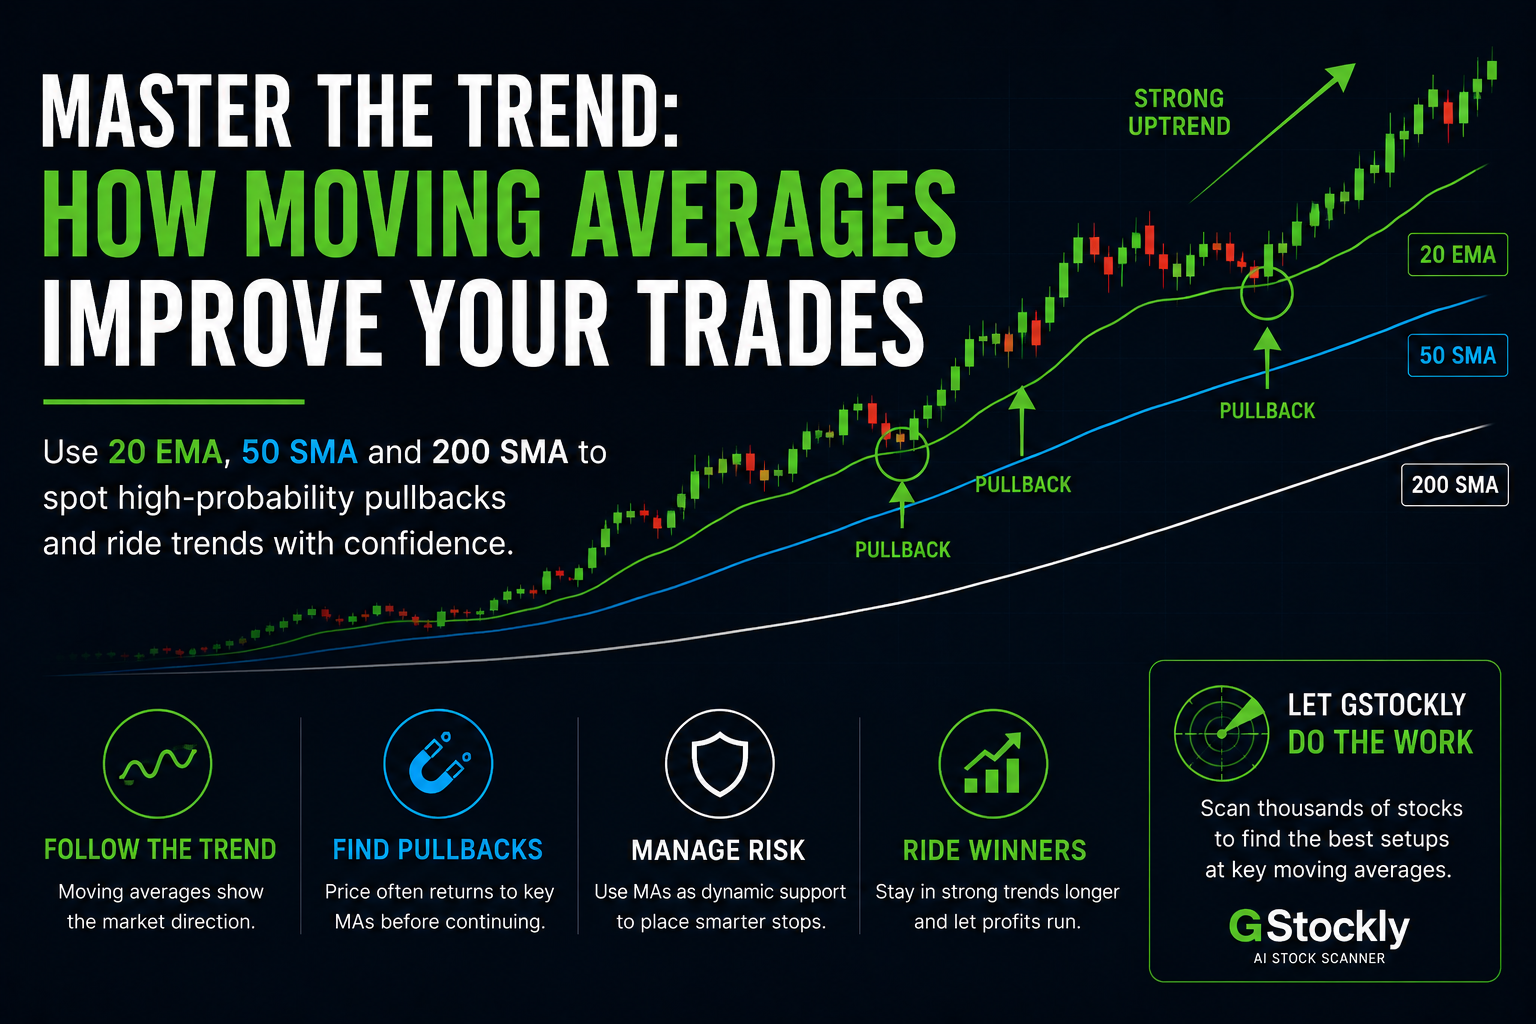
The most common moving averages are:
- 20 EMA (Exponential Moving Average)
- 50 SMA (Simple Moving Average)
- 200 SMA (Simple Moving Average)
Why Traders Watch the 20 EMA
The 20 EMA is commonly used to identify short-term momentum and fast-moving trends.
In strong bullish trends, price often pulls back toward the 20 EMA before continuing higher.
This creates potential low-risk opportunities for trend-following traders.
What Traders Look For
- Strong uptrend structure
- Controlled pullback toward the EMA
- Declining selling pressure
- Bullish bounce from the moving average
Why the 50 SMA Is So Important
The 50-day moving average is one of the most respected levels in the market.
Many swing traders and institutional participants use it to judge medium-term trend strength.
Stocks above the 50 SMA are generally considered technically healthier than stocks trading below it.
Why It Works
Because millions of traders monitor the same level, reactions often become self-reinforcing.
When strong stocks pull back toward the 50 SMA, buyers frequently become active again.
The Power of the 200 SMA
The 200-day moving average is considered one of the most important long-term trend indicators in financial markets.
Large institutions often monitor this level very closely.
Many investors view stocks above the 200 SMA as being in long-term uptrends.
Why the 200 SMA Matters
- Acts as long-term institutional support
- Defines overall market trend direction
- Often creates major psychological reactions
- Widely followed across global markets
Moving Averages Help Define Trend Quality
One of the biggest mistakes beginners make is focusing only on entry signals.
Professional traders focus heavily on trend quality.
Moving averages help traders quickly answer questions like:
- Is the stock trending?
- Is momentum strengthening or weakening?
- Is price extended?
- Is the trend healthy?
Strong trends usually respect key moving averages repeatedly.
Weak stocks constantly break below them.
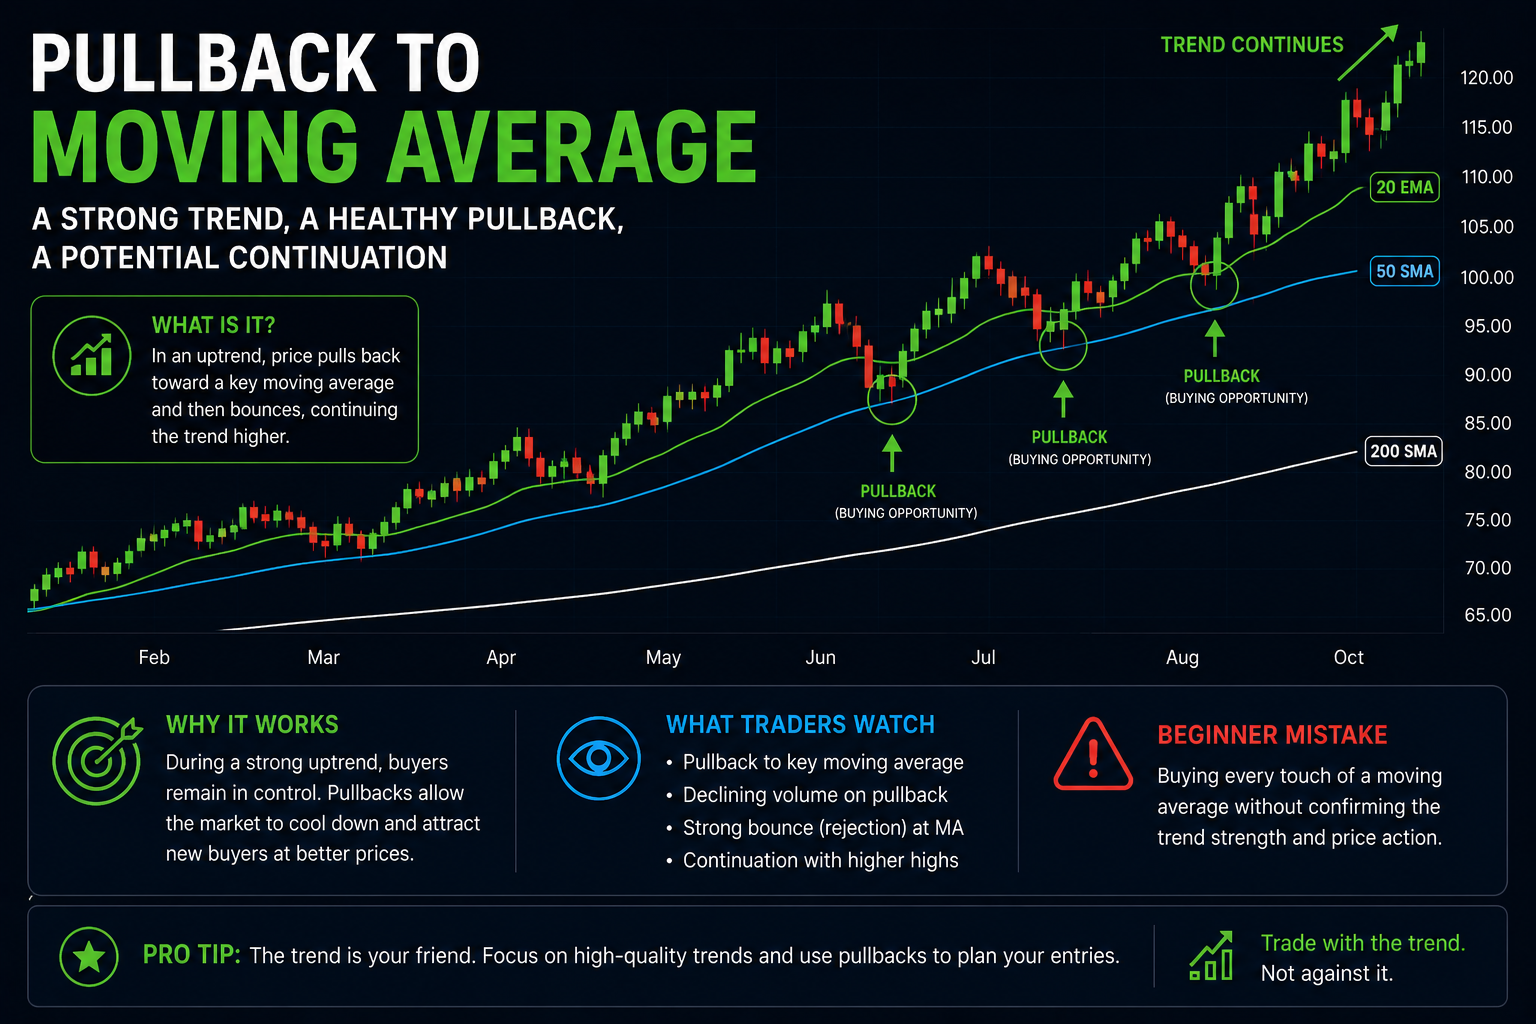
Why Pullbacks Matter
Strong stocks rarely move upward forever without pauses.
Healthy pullbacks are completely normal.
In fact, many experienced traders prefer buying pullbacks rather than chasing extended breakouts.
Pullbacks toward moving averages often provide:
- Lower-risk entries
- Clearer stop placement
- Better reward-to-risk opportunities
- Improved trend continuation setups
In strong trends, pullbacks often represent healthy pauses before continuation.
The Real Challenge: Finding These Setups Early
Every day, thousands of stocks interact with moving averages.
Some bounce strongly from the 20 EMA.
Some recover from the 50 SMA.
Others break below the 200 SMA and signal weakness.
No trader can manually monitor thousands of charts efficiently.
This is exactly why stock scanners are so valuable.
A good scanner can instantly detect stocks:
- Pulling back toward moving averages
- Bouncing from support
- Showing strong relative momentum
- Breaking above key technical levels
Instead of wasting hours searching manually, traders can focus directly on high-quality opportunities.
Final Thoughts
Moving averages are much more than simple lines on a chart.
They help traders identify trend direction, momentum, pullbacks, and institutional interest.
Because millions of market participants monitor the same levels, moving averages often become self-fulfilling technical areas.
The real edge comes from recognizing high-quality setups early — before the majority of traders notice them.
In the next article, we’ll explore how stock scanners help traders analyze thousands of stocks automatically and detect technical opportunities in seconds.